This post was written by Will Grana on behalf of the Case Foundation:
Before you clicked to this blog post, you probably checked your email, liked a page on Facebook, followed your favorite musician on Twitter, shared a video, searched for a restaurant on Google, and let your online friends know about the good deal you just got on shoes. Well, maybe you didn’t do that all today, but if you’re online you’ve likely done all of this within the past couple days. And if you have, then you are being mapped in a graph that is capturing your preferences and practices so that an even more tailored, relevant experience can be presented to you the next time you’re online or open an application.
There’s so much data online that it might be hard to understand how it’s all connected, and how we’re all connected. But that’s where the social and interest graphs come in – they help us to visualize our connections to each other and the information we’re sharing. In the last few years, graphs have had a deep impact on how billions of people around the world interact with each other, both online and offline.
Retailers, marketers, and agencies use social graphs on websites like Facebook, Twitter, and Amazon to gather data about their users and connect them with people they know, all while discovering new products, learning new things, and finding new interests. The companies get a better understanding of consumer behavior, which leads to a higher return-on-investment (ROI), and the users get a better experience over time.
But at the Case Foundation, we think the time just might be right to take things to the next level! What if there was a tool that could help the social sector connect people to causes they are passionate about in a seamless way that is just part of our everyday actions and exploration online? The data is out there, but there’s no easy way for nonprofits or other organizations trying to catalyze good to leverage it in a frictionless, natural way.
And so, the idea of the Giving Graph was born. And we want to know what you think about the idea.
No, we don’t want to create a new social network. And we’re not trying to create another Network for Good or Causes. We don’t want to force yet another login and password upon users. Rather, we see an opportunity to layer the Giving Graph into a user’s experiences into platforms and networks they’re already using, like Spotify or Facebook. The connections made through the Giving Graph could give organizations that are working to create good the same edge as companies trying to sell you more stuff!
The Giving Graph concept ties to our core belief that philanthropy must be more democratized, socialized, and crowdsourced. As community needs increase and traditional sources of nonprofit funding decrease, we must disrupt current systems and ensure that everyday folks are inspired to step up and have easy to use, easy to access tools to make giving and giving back a seamless part of everyday life. The Giving Graph could integrate giving, volunteering, and advocating for your causes a seamless part of your “social” life and make it possible for nonprofits to reach people through as many social media channels as possible in a logical, targeted manner.
For example:
Bob loves everything about Africa. In the past few days, he liked Victoria Falls on Facebook, bought a LivingSocial adventure trip to Zimbabwe, and has shared Spotify tracks from Ladysmith Black Mambazo and South African soprano Miriam Makeba. In today’s world, Bob’s actions would prompt him to see more ads for vacation services, hotels, and similar music reccomendations. But in the world of the Giving Graph he is shown African volunteer vacations from MercyCorps, nonprofits near Victoria Falls featured on GlobalGiving, and a petition from Change.org encouraging more clean vehicles on safaris. He also sees that his friends Mike and Kristen will be running in the upcoming Malaria No More marathon and are seeking supporters.
The possibilities are endless. Listening to a new artist on Spotify recommended by your friend could turn you into a donor for the artist’s favorite cause, and buying a documentary on your mom’s Amazon Wishlist might inspire you to watch films in your town that support issues you care about. The Giving Graph would be the gateway that highlights opportunities to give, online and offline, to millions of users, in a way like never before. After all, the data tells us more than four in 10 Americans still get their information about causes from family and friends. We also know that 45 percent of our daily activities are habitual, and that we’re more likely to take action when we’re doing the behaviors we’ve already formed, rather than adding another item for the to-do list. The Giving Graph could accelerate numerous efforts to make giving back something that’s easy, intuitive, fun, and second nature – for everyone. Imagine what could happen next.
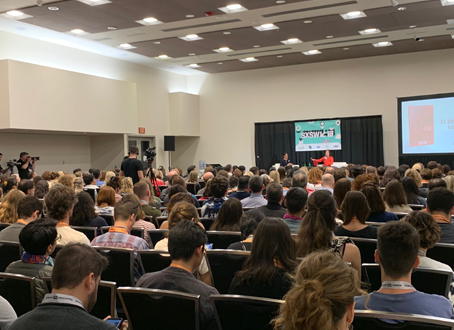
This is just an idea – one we’ve thought quite a bit about. But before we go any further or encourage others to do so, we want to know what you think. So, what questions and ideas do you have? If you think we’re on to something or should rethink this concept, join the conversation about the Giving Graph at SXSW Interactive this Saturday–when our very own Will Grana, VP of Interactive Technologies will present on the concept. It’s also your opportunity to be a part of the #givinggraph conversation on Twitter, just look for updates on how to get involved.


